Physical Address
304 North Cardinal St.
Dorchester Center, MA 02124
Physical Address
304 North Cardinal St.
Dorchester Center, MA 02124

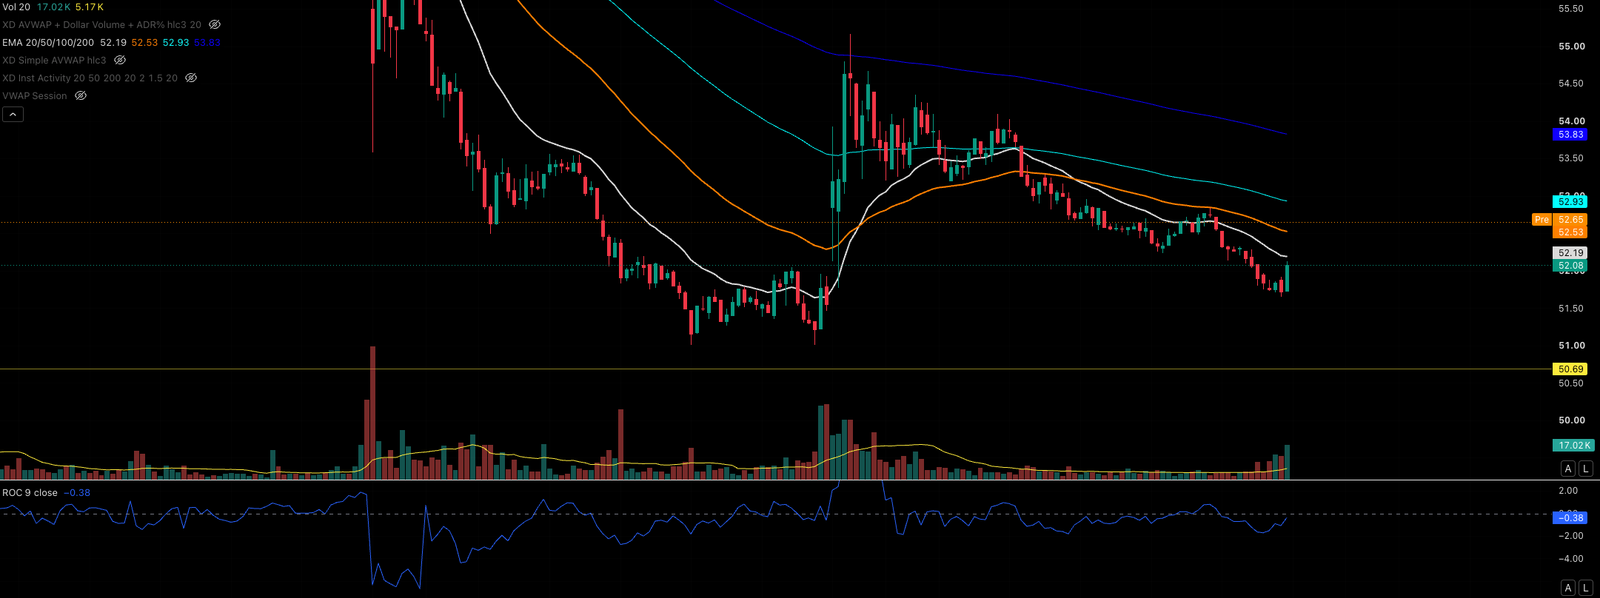
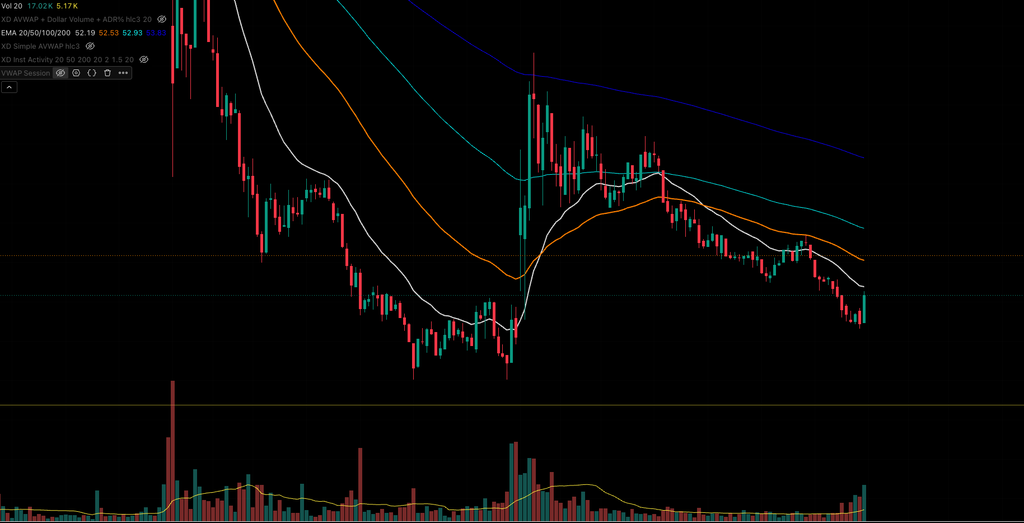
EMA (Exponential Moving Average) is one of the most common trend indicators in TradingView’s indicator panel. In TradingView, open the Indicators panel, search for Exponential Moving Average, and set the lengths to 20 / 50 / 100 / 200. This post uses the EMA20 / EMA50 / EMA100 / EMA200 set. The key difference from a simple moving average (SMA) is that more recent prices carry higher weight, so EMA reacts faster to the latest price change.
EMA20 is not the simple average of the last 20 candles. It applies exponential weighting to the last 20 candles, putting more emphasis on recent prices. The same EMA20 represents completely different time scales on different timeframes:
So remember this first rule: the meaning of EMA20 depends on the timeframe you are looking at. Outside of a timeframe, the number carries no judgment value.
To judge the state of EMA, don’t stare at values. Look at three things: where Price sits relative to EMA, the slope of EMA, and EMA alignment.
Price vs. EMA position. Price above EMA20 means the short-term trend is strong; Price below EMA20 means it is weak. But a single cross is not enough to confirm a trend change — one cross is a signal, not a conclusion.
The slope. EMA20 rising means an uptrend; flat means ranging and a weakening trend; falling means a downtrend. Here is a critical distinction: Price > EMA20 while EMA20 is still falling hard is a completely different state from Price > EMA20 with EMA20 already turning up. The former is price merely holding above the line; the latter is the trend itself turning stronger. Check the slope before you judge the position.
EMA alignment. Strong bull alignment: Price > EMA20 > EMA50 > EMA100 > EMA200 — a mature uptrend. Strong bear alignment: Price < EMA20 < EMA50 < EMA100 < EMA200 — a mature downtrend. Alignment is the most direct expression of trend maturity, and the layer that carries the most information of the three.
This is the first thing to note carefully. There is no such concept as “EMA20 equals 70 is normal, 100 is abnormal.” EMA must be read through relative relationships:
No single moving average value means anything on its own. What matters is the trend state composed of these relative relationships.
One situation worth noting: price drifting too far from EMA20. In a normal trend, price usually sits only 3%–5% away from EMA20. When it suddenly stretches to 15%–20%, the short-term move may be overheated. It does not necessarily fall, but the risk of mean reversion increases.
So: too far from EMA = Extension. It is a warning of short-term overheating, a hint that mean-reversion risk is rising — not a verdict that the trend has reversed.
Summary. EMA is never about the value of one line. It is about the relative relationships among price, slope, and alignment. When you put it on a TradingView chart, set the timeframe first, then read Price vs. EMA, then the slope, then the alignment — only then do the EMA20 / 50 / 100 / 200 set carry judgment value.